
Parent Pages
Sibling Pages
Child Pages
The Spring, 2000 SOL data showed up on the State Education Dept web site on October 11, 2000. With the full dataset we can compare Richmond with other jurisdictions.
Other pages look at the 3d and 5th grade and high school scores.. Here we start with 8th grade writing. The data here again are % pass rates by school division by subject. According to the Education Dept. web site, these are unadjusted scores (include special ed students et al whose scores will be removed to determine whether the divisions will be accredited). With that caveat, here are the scores.
Richmond again managed to beat only Petersburg. Overall the Richmond scores increased slightly; extrapolated the average will reach the accreditation standard of 70 in 2010.
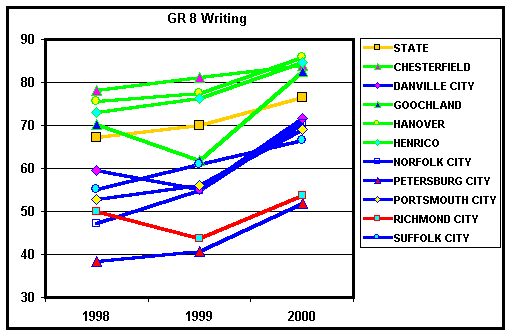
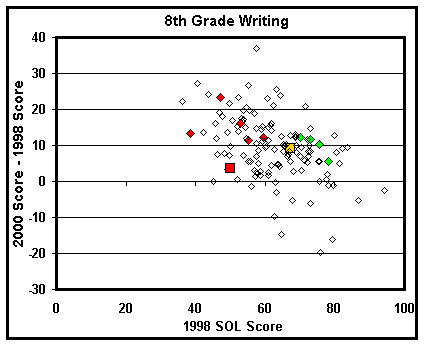
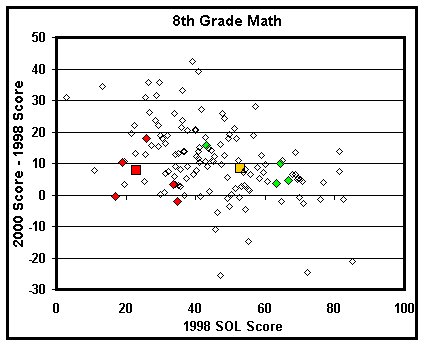
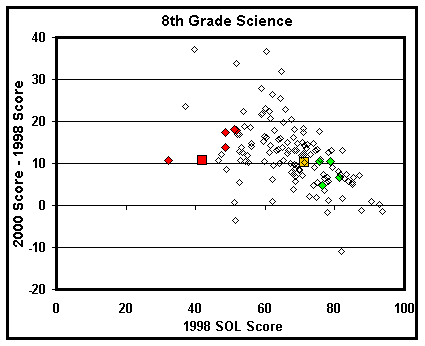
Looking at the change from '08 to '00 (for all the Virginia school divisions) we see Richmond (red square) behind and dropping farther behind the state average (gold square). The Richmond suburbs all started ahead of the state average and all but Chesterfield improved more than the State. The cellar cities of Danville, Norfolk, Petersburg, Portsmouth, and Suffolk all improved substantially more than Richmond.
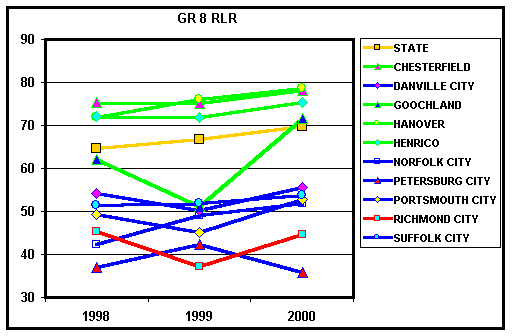
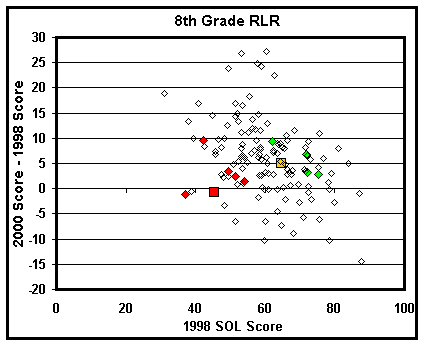
Eighth grade RLR have decreased overall; the extrapolation never reaches 70.
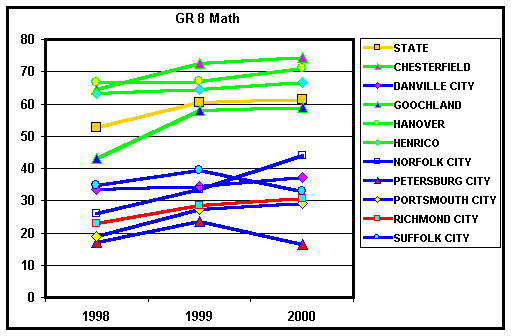
The eighth grade math scores are terrible, but at least they are increasing sufficiently that the extrapolation reaches 70 in 2010.
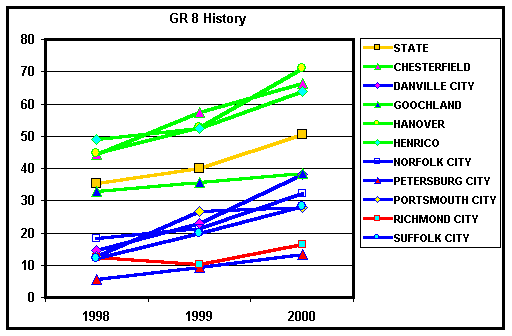
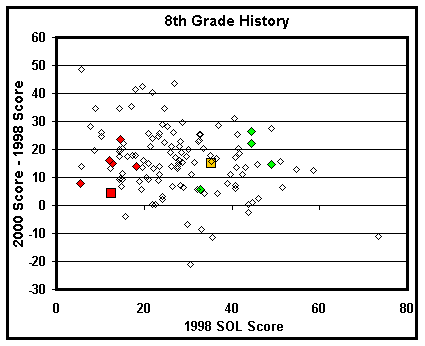
The eighth grade history scores are dismal and increasing so slowly that the extrapolation does not reach 70 until 2026.
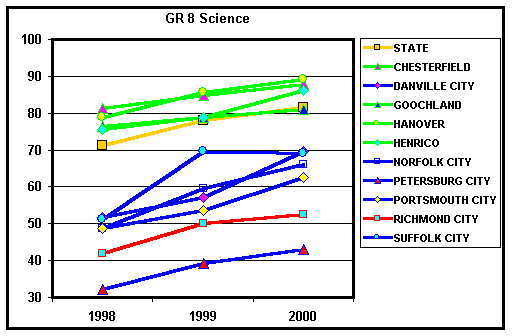
The eighth grade science scores are low but increasing nicely, with the extrapolation reaching 70 in 2003.
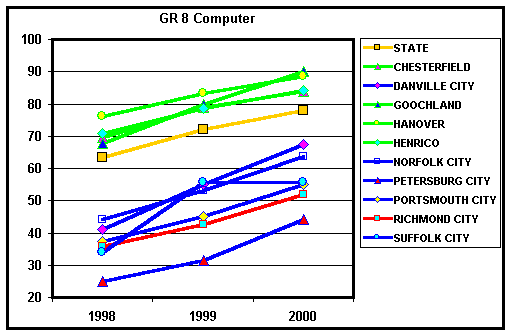
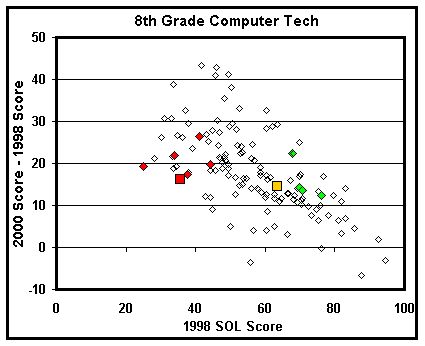
Computer technology starts low but, as with the fifth grade computer tech, shows nice improvement, with the extrapolation reaching 70 in 2002.
Back to the Top
Back to the Testing Page
Back to the Issues Page
Last updated 02/24/02
Please send questions or comments to John
Butcher