Parent Pages
Sibling Pages
Child Pages
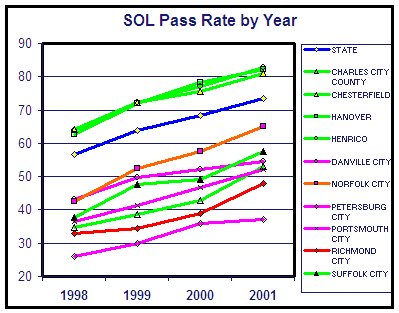
You have seen the Governor bragging on the improved SOL scores. There is room to dispute what the increase means, but for sure the scores are up:
The blue curve there is the statewide average SOL score. It is up from 56.6 in '98 to 73.4 in '01. In the same period, the Richmond average score increased from 32.8 to 48.1.
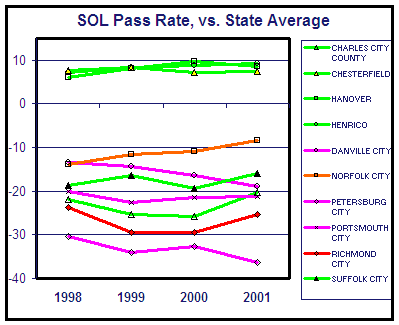
Unfortunately, this rising tide did not lift all the boats equally:
Chesterfield, Hanover, and Henrico all started out better than the state average (7.6, 6.2, and 7.1 points); over the four years, Chesterfield dropped slightly to 7.5 points above the state; Hanover improved from 6.2 to 8.7 and Henrico improved from 7.1 to 9.3.
The Superstar here was Norfolk. They advanced 5.6 points on the state average, starting out 13.9 points behind the state and improving to 8.3 points behind.
Richmond, in contrast, started 23.5 points behind the state average in 1998. In 2001 we were 25.5 points behind. That is, we lost two points to the state average.
The only worse news was from Danville (fell from 13.5 below to 19.0 points behind) and Petersburg (dropped from 30.4 to 36.3 points behind the state average).
Norfolk brings the Good News that an inferior school district (and one in an older city with a clientele similar to ours) can pull up these scores. Plainly enough Richmond hasn't figured out how to do it. Our scores are terrible and getting worse.
Richmond also has a problem with getting its schools accredited. You'll recall the State classifies schools in four categories:
- Fully Accredited
- "Meets Standards" (Meets benchmarks toward full accreditation)
- "Needs Improvement" (Within 20 points of the benchmarks)
- Warning (More than 20 points behind the benchmarks).
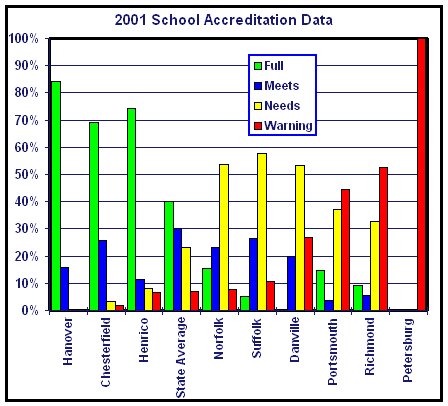
Here are the data for Richmond, the suburban jurisdictions, and the comparable urban jurisdictions:
DIVISION Full Meets Needs Warning Full+Meets Hanover 84% 16% 0% 0% 100% Chesterfield 69% 26% 3% 2% 95% Henrico 74% 11% 8% 6% 85% State Average 40% 30% 23% 7% 70% Norfolk 15% 23% 54% 8% 38% Suffolk 5% 26% 58% 11% 32% Danville 0% 20% 53% 27% 20% Portsmouth 15% 4% 37% 44% 19% Richmond 9% 5% 33% 53% 15% Petersburg 0% 0% 0% 100% 0% As you see, statewide 70% of the schools are fully accredited or meet the guidelines. In Richmond, it's 15%. Statewide only 7% of the schools are on warning. In Richmond it's 53%.
Here are those data in graphical form:
We don't get bragging rights except on poor Petersburg.
We continue to pay a very high price for these sorry results:
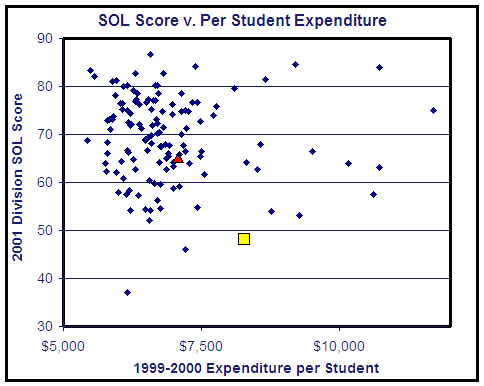
Division $/Student 01 SOL HANOVER 5,554 82.1 CHESTERFIELD 5,879 81.0 PETERSBURG CITY 6,164 37.1 HENRICO 6,299 82.8 DANVILLE CITY 6,479 54.5 PORTSMOUTH CITY 6,548 52.2 STATE 6,985 73.4 NORFOLK CITY 7,087 65.2 RICHMOND CITY 8,276 48.1 We are 25.3 points behind the state average SOL but we pay $1291 (18.5%) more than the state average cost per pupil. Here are the statewide data in graphical form:
Richmond is the yellow square; Norfolk is the red triangle.
You'll notice we are the third worst division in the state in terms of the average SOL. Well, the division of correctional education was even lower than Petersburg, but among the municipal school divisions, we're 3d from the bottom. And we are among the most expensive. Something is seriously wrong here.
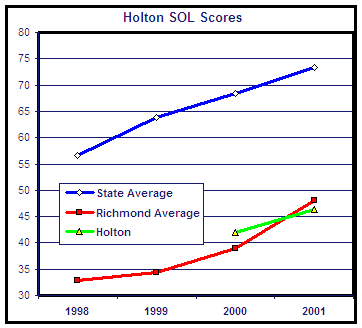
Turning to our own neighborhood, here are the Holton SOL scores, compared to the Richmond and state averages for the elementary grades:
Holton, the green curve, started out in 2000 just above the (already awful) Richmond average. Holton lost ground in 2001. Looking at the same data in terms of difference from the statewide average for elementary schools, we see that Holton also lost ground vs. the state average.
Last updated
02/28/02
Please send questions or comments to John
Butcher
