
Parent Pages
Sibling Pages
Child Pages
Here are John's comments on the proposed 2001-02 school budget: We also have the exchange of email it provoked.
Mark E. Emblidge, Chairman
Richmond School Board
301 North Ninth Street
Richmond, Virginia 23219RE: Proposed Budget for 2001-02
Dear Mr. Emblidge:
Thank you for the opportunity to comment upon the proposed 2001-02 budget for the Richmond schools.
The budget raises three questions:
Will this budget reduce our schools’ very high cost or improve their inadequate performance?
Should Richmond offer equal rewards to all teachers, whether they teach well or poorly?
Should the Richmond schools expand their large, costly bureaucracy?
I will discuss these matters in turn.
Richmond Has the Sixth Most
Costly School System in Virginia
But the Test Scores Are Very Low and
Falling Farther Behind the State AverageIn terms of expenditure per pupil, we have the sixth most expensive school system in Virginia (1998 data [1]) yet we are second from last in average SOL score (Spring, 2000 data [2]):
DIVISION NAME
Per Pupil Expenditure
00 Avg SOL
Expend. Rank
SOL Rank
FALLS CHURCH CITY
9989
82
1
5
ALEXANDRIA CITY
9699
59
2
93
ARLINGTON
9667
71
3
36
CHARLOTTESVILLE CITY
8486
55
4
109
SURRY
8312
57
5
103
RICHMOND CITY
8093
39
6
128
LEXINGTON CITY
7920
88
7
1
BATH
7895
67
8
57
CHARLES CITY COUNTY
7852
43
9
127
STATE AVERAGE
6002
68
NORFOLK CITY
5928
57
36
99
PORTSMOUTH CITY
5621
47
63
125
HENRICO
5542
77
67
13
DANVILLE CITY
5433
52
81
115
SUFFOLK CITY
5334
49
93
120
CHESTERFIELD
4995
76
117
15
PETERSBURG CITY
4898
36
124
129
HANOVER
4721
78
128
10
In the table the "Per Pupil Expenditure" column shows the annual expenditure divided by the average daily membership. The last two columns rank the per pupil expenditure (highest = 1) and the division SOL scores (highest = 1).
The table above includes data for the nine most expensive jurisdictions, the Richmond suburbs (green) and the comparable urban jurisdictions (red). The suburbs and urban jurisdictions are spending $2,100 to $3,300 per student less than we are and, except for Petersburg, they all have much have better SOL scores than we do. Norfolk, which also is an older city with a large population of low-income children,[3] has an average SOL 28 points (46%) higher than ours at a per-student cost $2,165 (27%) less.
These data do not reveal why we are paying so much more money for generally lower scores.
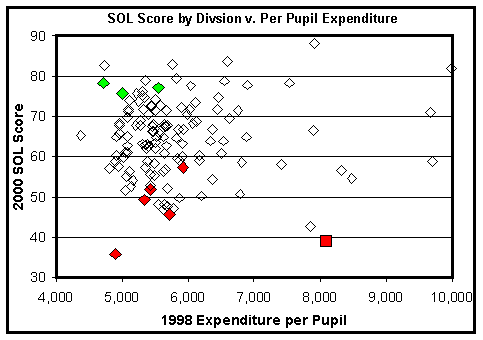
Here is a graphical view of these data:
Richmond is the red square. The green points are, from the left, Hanover, Chesterfield, and Henrico. The red diamonds, also from the left, are Petersburg, Suffolk, Danville, Portsmouth, and Norfolk.
Again, all these jurisdictions are spending more than $2,100 per student less than we are and all but Petersburg are performing better.
As to accreditation, please recall that the State classifies schools into four categories:
Fully Accredited – Meets all SOL requirements
Provisionally Accredited – Meets benchmarks toward the 2007 deadline for full accreditation
Needs Improvement – Within 20 points of the benchmarks
Warning – 20 points or more below the benchmarks
The State Education Department web site lists both the 2000 accreditation status [4] and the 1998 expenditure per pupil [5] for 131 school divisions. Here is an excerpt from these data:
Division
Per-Pupil Expenditure
Full+ Provisional
Expenditure Rank
Accreditation Rank
Falls Church
$ 9,989
100%
1
1
Alexandria
$ 9,699
47%
2
81
Arlington
$ 9,667
83%
3
32
Charlottesville
$ 8,486
11%
4
111
Surry
$ 8,312
33%
5
88
Richmond City
$ 8,093
12%
6
110
Lexington
$ 7,920
100%
7
2
Bath
$ 7,895
67%
8
52
Charles City
$ 7,852
0%
9
117
STATE AVERAGE
$ 6,002
60.5%
Norfolk
$ 5,928
35%
37
87
Portsmouth
$ 5,621
11%
65
112
Henrico
$ 5,542
72%
69
45
Danville
$ 5,433
13%
83
109
Suffolk
$ 5,334
22%
95
102
Chesterfield
$ 4,995
81%
119
35
Petersburg
$ 4,898
0%
126
131
Hanover
$ 4,721
94%
130
22
The "Per Pupil" column here again lists the 1997-98 expenditure of the school system divided by the average daily membership. The "Full+Provisional" column lists the percent of the schools that were fully or provisionally accredited in 2000. The two remaining columns rank the divisions by expenditure (1 = largest) and Full+Provisional accreditation (1 = highest).
Here we see Richmond with the sixth largest per pupil expenditure placing 110 of 131 in accreditation of its schools. Please note that Norfolk has almost a threefold better accreditation percentage at a per student cost $2,165 per year less than Richmond.
Here is a graphical view of the expenditure and accreditation data:
Richmond again is the red square. The three green points are, from the top, Hanover, Chesterfield, and Henrico Counties. The red diamonds are, from the top, Norfolk, Suffolk, Danville, Portsmouth, and Petersburg. Here again we see that Richmond is spending $2,100-3,300 more per student than the adjacent suburbs and the comparable urban jurisdictions and, except for Portsmouth and Petersburg, obtaining worse results.
The data do not reveal why our current (and very large) expenditure is producing such poor results. Neither does proposed budget explain why increasing that expenditure would improve the results.
Turning to changes in SOL scores from 1998 to the present,[6] here is a comparison of the Richmond SOL scores with the statewide average, by subject.
'98 Score
Change '98 - '00
Subject
Richmond
State
Difference
Richmond
State
Difference
3 English
35
55
-20
2
6
-4
3 Math
40
64
-23
4
8
-4
3 History
27
49
-22
13
16
-3
3 Science
37
63
-27
12
10
2
5 Write
50
65
-15
12
16
-4
5 RLR
46
68
-22
-3
0
-3
5 Math
22
47
-24
15
17
-2
5 History
12
33
-21
10
18
-8
5 Science
36
59
-23
0
5
-5
5 Computer
47
72
-26
19
13
6
8 Write
50
67
-17
4
9
-6
8 English
45
65
-19
-1
5
-6
8 Math
23
53
-30
8
9
-1
8 History
12
35
-23
4
15
-11
8 Science
42
71
-29
11
10
0
8 Computer
36
63
-28
16
14
2
EOC Write
58
71
-12
6
14
-9
EOC RLR
56
72
-15
-1
7
-7
Algebra I
14
40
-26
7
25
-18
Geometry
19
52
-33
6
15
-9
Algebra II
9
31
-22
8
27
-19
US History
10
30
-21
2
9
-7
Earth Science
25
58
-33
12
12
0
Biology
37
72
-36
14
7
7
Chemistry
18
54
-37
2
9
-8
Average
32
56
-24
7
12
-5
As you see, we are far behind the state average in every subject. Of the 25 subjects where the data allow the calculation, Richmond improved less than the statewide average in 20. Indeed, in 1998 Richmond started out 24 points behind the statewide average SOL score. By 2000 we had fallen to 29 points behind the average. In short we started out far behind and we are falling farther behind the other Virginia school districts.
These data can be extrapolated to measure our progress toward accreditation. Here for example is a table showing the years in which an extrapolation of the average test scores will reach the accreditation requirement:
Subject
Year
3 English*
2011
* Pass = 75%
3 Math
2014
** Pass = 50%
3 History**
2005
3 Science**
2004
5 Write*
1998
5 RLR*
Never
5 Math
2004
5 History
2010
5 Science
Never
5 Computer
2000
8 Write
2009
8 English
Never
8 Math
2010
8 History
2026
8 Science
2003
8 Computer
2002
EOC Write
2002
EOC RLR
Never
Algebra I
2014
Geometry
2016
Algebra II
2013
US History
2062
Earth Science
2006
Biology
2003
Chemistry
2066
Please note that this calculation oversimplifies the problem: When the average reaches the accreditation level, perhaps half the students (and half the schools) will be below that level.[7] Even by this relaxed standard, Richmond’s average scores do not reach the accreditation level by 2007 in fifteen of twenty-five subjects. Of course, in four of those subjects the scores are declining so the extrapolation never reaches the accreditation standard.
Richmond’s poor performance is not restricted to the SOL test. For example, here is a summary of Richmond’s rank in the Reading, Math, Language, and Basic Battery scores on the 1999 Stanford 9: [8]
1999 Stanford 9 Rank by Test
Reading
Math
Language
Basic Battery
Grade 4
129/132
121/132
117/132
125/132
Grade 6
131/132*
131/132
129/132
131/132
Grade 9
131/131
126/131
125/131
130/131
* Tie for last with Petersburg
The best ranking was 117 of 132 in Fourth Grade Language, i.e., fifteenth school division from the bottom. The average of the twelve scores was fifth from the last (of 131 or 132 divisions).
Our Stanford 9 scores are declining, both in absolute terms and, even more rapidly, versus the state. Here for example are the changes (in percentile scores) of the four major Stanford 9 rankings for Richmond from 1998 to 1999.
Richmond, 1998 to 1999
Grade
4
6
9
TOTAL READING
(2)
(2)
(2)
TOTAL MATHEMATICS
0
(1)
0
LANGUAGE
0
(1)
0
PARTIAL (Basic) BATTERY
(1)
(2)
0
As you see, Richmond held even in five cases and deteriorated in seven.
In contrast, during the same period all the statewide average scores improved:
State, 1998 to 1999
Grade
4
6
9
TOTAL READING
2
1
2
TOTAL MATHEMATICS
4
4
1
LANGUAGE
3
2
2
PARTIAL (Basic) BATTERY
3
2
1
Compared to the statewide scores, all the Richmond scores decreased:
Ric. v. State, 1998 to 1999
Grade
4
6
9
TOTAL READING
(4)
(3)
(4)
TOTAL MATHEMATICS
(4)
(5)
(1)
LANGUAGE
(3)
(3)
(2)
PARTIAL (Basic) BATTERY
(4)
(4)
(1)
These data directly contradict the statement in the budget that the scores show "we have implemented both an organizational structure and instructional model designed for success." In fact, we are far behind and falling ever farther behind the rest of the state. These data tell of systematic failure, not a "model designed for success."
Unfortunately, aside from the $500,000 increase in the summer school budget, the proposed budget does not attempt to correct this pervasive failure of our schools. Instead the budget proposes to increase by $8 million per year our spending on approaches that already have failed to educate our children.
The Budget Proposes to Reward Poor Teaching
In the Same Manner as Better TeachingThe Budget proposes an across-the-board pay increase and a step increase for all teachers and administrative personnel. Thus, the budget proposes to reward all personnel without reference to their performance.
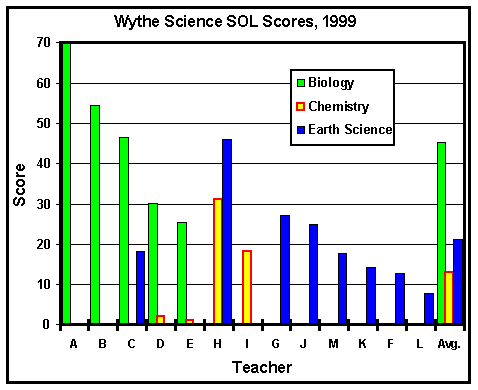
The SOL data show some large differences in performance. For example, looking at the 1999 science SOLs at George Wythe High School, [9] we see:
(I have replaced the teachers’ names here with arbitrary letters – the purpose of this discussion is to point out differences in performance, not to embarrass particular teachers.)
The biology scores (green) range from 69.7 (rounds up to full accreditation) to 25.4, with an average of 45.3. Thus Teacher A obtained results more than 20 points above the average for the school while Teacher E was twenty points below the average. [10]
In chemistry (the red-bordered yellow bars), the high score was only 31 while the low score was zero (plotted at 0.5 to cause the bar to appear on the graph), with an average of 12.9. Thus the best performing teacher (of this poor lot) obtained results better than twice the average score while the worst-performing teacher failed to pass a single student.
In earth science (blue bars), the high score was 46, the low was 7, and the average was 21. That is, one teacher achieved results twice the average and another only reached 1/3 of the average score.
Four of these teachers taught sections of two different courses. We see for example that Teacher H did better than twice the average in both earth science and chemistry while Teacher C turned in nearly average results in Biology and Earth Science. The budget would reward these teachers exactly the same as Teachers D and E, whose students performed far below average in earth science and bottomed out in chemistry.
I submit that rewarding Teachers D and E is a misuse of tax money. These teachers must be retrained and, if they cannot learn to do their jobs, they must be replaced. Moreover, rewarding the relatively superior performance of Teacher H in exactly the same manner as the plainly inadequate performance of Teachers D and E rewards Teachers D and E for failing to do their jobs while punishing Teacher H for superior accomplishment.
This budget would reward failure and punish success. In this respect the budget is perverse.
The Budget Would Increase
Our Already Bloated BureaucracyRichmond already has the second largest school bureaucracy among the urban jurisdictions. Here are the 1998 data: [11]
City
ADM
Admin/ Student
Students/ Admin
Danville
7919
0.068
14.6
Richmond City
25497
0.041
24.3
Portsmouth
17521
0.038
26.5
Norfolk
35882
0.034
29.2
Petersburg
6198
0.033
30.5
Suffolk
10728
0.032
31.2
Here "Admin/Student" is the ratio of the number of administrators in the system to the ADM; "Students/Admin" is the reciprocal of that ratio.
If we compare Richmond to Norfolk, the other large city with a substantial population of poor children, we see that Richmond has 7 more administrators per thousand students. At the 1998 Richmond ADM of 25,497, this calculates to 178 more administrators. At the average salary of about $35,000 per year, we pay that surplus of administrators $6.2 million per year.
The budget proposes to exacerbate this situation. It would reduce the number of teachers and increase the number of administrators as follows:
-45 FTE Instructional Personnel -- Enrollment loss
+8 FTE Technology Support
+1 FTE "International Baccalaureate Coordinator"
Convert Elementary Teacher Specialists to Ass’t Principals (i.e., bureaucrats)
Overall the budget would increase the number of administrators to 0.049 per pupil, [12] i.e., 365 excess administrators compared to the ’98 Norfolk number, at an excess salary cost of $12.8 million.
Whatever administrators do in the Richmond system, it has not contributed to superior or even adequate performance. It has produced unacceptably poor performance. This budget would add still more administrators to a system that already has too many.
Conclusion
The proposed school budget:
Spends far too much money, particularly in light of the remarkably high cost and poor performance of our school system;
Does not redirect funds to curing our dismal test scores and minimal progress toward accreditation;
Rewards teachers who contribute to the failure of our schools and students; and
Augments our large and unproductive bureaucracy.
I recommend that the Board:
Reject this proposed budget and
Direct the Superintendent to prepare a new budget that
Takes positive steps to improve our test scores,
Rewards superior teaching, and
Reduces administrative expense.
With renewed thanks for the opportunity to comment on the budget and with kindest regards, I am
Sincerely,
John Butcher
Notes:
[1] http://www.pen.k12.va.us/VDOE/Publications/asrstat/1997-98/table13.xls The 1999 data are not yet available on the Web.
[2] http://www.pen.k12.va.us/VDOE/Assessment/soltests/y2kscores.html
[3] As of 1997, the Census Bureau estimated that 33% of Norfolk’s children and 37 % of Richmond’s children were “poor.” http://www.census.gov/hhes/www/saipe/school/sd97ftpdoc.html
[4] http://www.pen.k12.va.us/VDOE/Assessment/accredstatus.html
[5] http://www.pen.k12.va.us/VDOE/Publications/asrstat/1997-98/table13.xls The 1999 data are not available on the Web as of 1/13/01. When available, see:. http://www.pen.k12.va.us/VDOE/Publications/asrstat/1998-99/asrbook.html
[6] The data are available at http://www.pen.k12.va.us/VDOE/Assessment/soltests/y2kscores.html
[7] Note, for example, that the state average score of 68 already is very near the general accreditation level (70) but many schools, notably including ours, are far below that level.
[8] http://www.pen.k12.va.us/VDOE/Assessment/VSAPreport/
[9] Data obtained in hard copy from the Richmond School Board. Unfortunately neither Richmond nor the State Education Department has these data in electronic form.
[10] The SOL data do not indicate whether any of these classes contained a selected population, e.g., an honors section. The school of course knows whether that is the case. Although this information might affect the evaluation of particular teachers, it does not affect the point of this illustration: Different teachers perform at different levels and we have tools to measure the differences.
[11] http://www.pen.k12.va.us/VDOE/Publications/asrstat/1997-98/table13.xls
[12] The budget proposes 3266.9 FTE’s, of whom 2050.8 are instructional class staff (after the 45 FTE reduction); the difference is 1216.1 administrative staff. At an average attendance of 91.4%, the projected enrollment of 27,216 projects an ADM of 24,875. The ratio of administrative staff to ADM then is 0.0489.
Back to the Top
Back to the Testing Page
Back to the Issues Page

Last updated
02/24/02
Please send questions or comments to John
Butcher