Parent Pages
Sibling Pages
Child Pages

The '99 SOL results are on the State Education Dept web site. As to Richmond, they are an astounding record of failure.
Here for completeness are the Richmond data, excerpted from the statewide spreadsheet (Excel spreadsheet, 116K). We also have some of the 99 data broken out by class.
Taking a bite sized approach, we start with the Third Grade English. Here are the data:
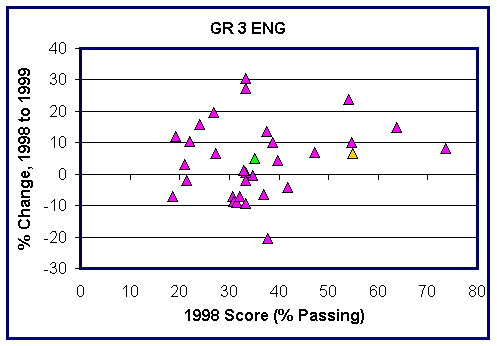
GR 3 ENG SCHOOL NAME 1998 1999 % CHG STATE SUMMARY 54.7293 61.3731 6.6438 DIVISION SUMMARY 35.0024 40.1223 5.1199 Bellevue 26.7857 46.3415 19.5558 Overby-Sheppard 21.4286 19.4444 -1.9842 Blackwell 30.6931 23.6842 -7.0089 Fox 54.0984 77.9070 23.8086 Swansboro 30.7692 22.0588 -8.7104 Ginter Park 34.6154 34.3137 -0.3017 RE Lee 33.3333 63.6364 30.3031 Mason 33.3333 33.9286 0.5953 Carver 21.9512 32.4074 10.4562 Oak Grove 41.7910 37.5000 -4.2910 Patrick Henry 38.7755 48.9362 10.1607 Stuart 47.2222 54.1667 6.9445 Summer Hill 21.0526 24.0000 2.9474 Munford 73.6111 81.8182 8.2071 Cary 39.6825 44.1860 4.5035 Woodville 31.3953 22.5000 -8.8953 Westover Hills 19.0476 31.0345 11.9869 Maymont 33.3333 24.1379 -9.1954 Fairfield Court 37.7778 17.1875 -20.5903 Whitcomb Court 18.6047 11.3636 -7.2411 Norrell 32.0000 25.0000 -7.0000 Clark Springs 36.9565 30.3571 -6.5994 Chimborazo 27.1739 33.6449 6.4710 Broad Rock 32.8125 33.9286 1.1161 Redd 33.3333 60.7143 27.3810 Greene 37.5000 51.0204 13.5204 Reid 33.3333 31.3725 -1.9608 Southampton 54.6667 64.8649 10.1982 Fisher 63.6364 78.5714 14.9350 Francis 23.8806 39.7436 15.8630 Here are the same data on a graph, showing the 1998-99 change as a function of the '98 SOL score (all data expressed as % passing)
The bad news is clear enough: The statewide average score in '98 was 54.7 (the gold point on the graph); the Richmond score was 35 (green point). The statewide score improved by 6.6% in '99, Richmond by 5.1%. It's bad enough that Richmond was 20 points behind the statewide average and improved less than that average; it's astounding that scores at twelve of the Richmond elementary schools decreased.
There is worse news to come. Here are the data for 3d grade math:
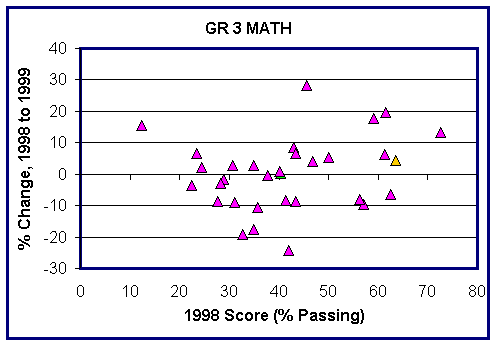
GR 3 MATH SCHOOL NAME 1998 1999 % CHG STATE SUMMARY 63.4576 67.8472 4.3896 DIVISION SUMMARY 40.3365 40.5959 .2594 Bellevue 42.8571 51.2195 8.3624 Overby-Sheppard 30.9524 21.9178 -9.0346 Blackwell 35.6436 25.0000 -10.6436 Fox 59.0164 76.7442 17.7278 Swansboro 41.8182 17.3913 -24.4269 Ginter Park 28.8462 27.1028 -1.7434 RE Lee 45.4545 73.5294 28.0749 Mason 37.7778 37.5000 -.2778 Carver 24.3902 26.6055 2.2153 Oak Grove 43.2836 34.5238 -8.7598 Patrick Henry 50.0000 55.3191 5.3191 Stuart 56.9444 47.2222 -9.7222 Summer Hill 22.3684 18.9189 -3.4495 Munford 72.6027 85.8696 13.2669 Cary 30.6452 33.3333 2.6881 Woodville 27.5862 18.7500 -8.8362 Westover Hills 12.1951 27.5862 15.3911 Maymont 23.3333 30.0000 6.6667 Fairfield Court 34.7826 17.1875 -17.5951 Whitcomb Court 32.5581 13.3333 -19.2248 Norrell 41.3333 32.8947 -8.4386 Clark Springs 34.7826 37.5000 2.7174 Chimborazo 28.2609 25.2336 -3.0273 Broad Rock 56.2500 48.2143 -8.0357 Redd 46.6667 50.8475 4.1808 Greene 62.5000 56.1224 -6.3776 Reid 40.0000 40.7767 .7767 Southampton 61.3333 67.5676 6.2343 Fisher 61.5385 81.1594 19.6209 Francis 43.2836 50.0000 6.7164
Note that the Richmond average in '98 was 40.3 vs. the statewide average of 63.4. The statewide average improved 4.4% in '99 while Richmond increased only 0.3%. Fifteen Richmond schools had scores that decreased.
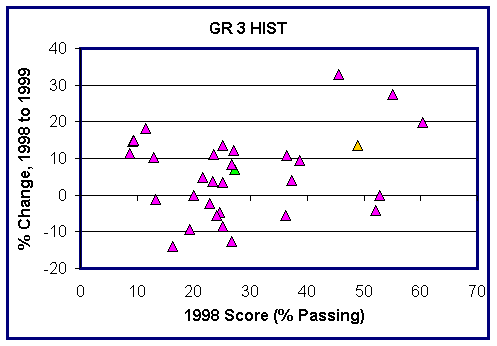
The Third Grade History results are similarly unsettling:
GR 3 HIST SCHOOL NAME 1998 1999 % CHG STATE SUMMARY 48.9258 62.4879 13.5621 DIVISION SUMMARY 27.2244 34.2093 6.9849 Bellevue 23.2143 26.8293 3.6150 Overby-Sheppard 13.2530 12.1212 -1.1318 Blackwell 24.5098 19.7368 -4.7730 Fox 55.0000 82.5581 27.5581 Swansboro 19.2308 10.0000 -9.2308 Ginter Park 21.4286 26.2136 4.7850 RE Lee 36.3636 47.0588 10.6952 Mason 25.0000 38.5965 13.5965 Carver 11.3821 29.5238 18.1417 Oak Grove 25.0000 28.3951 3.3951 Patrick Henry 52.0000 47.8261 -4.1739 Stuart 36.1111 30.5556 -5.5555 Summer Hill 25.0000 16.4384 -8.5616 Munford 60.2740 80.0000 19.7260 Cary 12.9032 23.2558 10.3526 Woodville 9.1954 23.7500 14.5546 Westover Hills 9.4118 24.4186 15.0068 Maymont 20.0000 20.0000 .0000 Fairfield Court 26.6667 14.0625 -12.6042 Whitcomb Court 16.2791 2.2727 -14.0064 Norrell 24.0000 18.4211 -5.5789 Clark Springs 8.6957 20.0000 11.3043 Chimborazo 22.8261 20.5607 -2.2654 Broad Rock 26.9841 39.2857 12.3016 Redd 26.6667 35.0000 8.3333 Greene 38.5417 47.9592 9.4175 Reid 37.1429 41.1765 4.0336 Southampton 52.7027 52.7027 .0000 Fisher 45.4545 78.2609 32.8064 Francis 23.4375 34.5679 11.1304
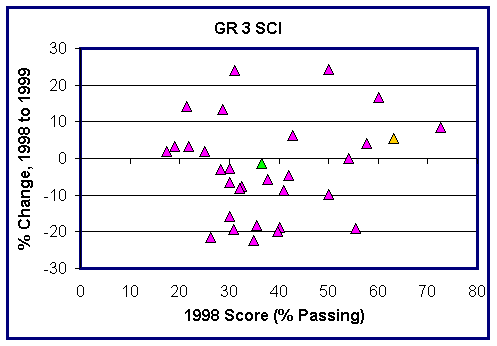
and the Third Grade Science numbers are affirmatively depressing
GR 3 SCI SCHOOL NAME 1998 1999 % CHG STATE SUMMARY 63.0337 68.4906 5.4569 DIVISION SUMMARY 36.5049 35.1288 -1.3761 Bellevue 25.0000 26.8293 1.8293 Overby-Sheppard 30.1205 23.5294 -6.5911 Blackwell 40.0000 21.0526 -18.9474 Fox 60.0000 76.7442 16.7442 Swansboro 30.7692 11.4286 -19.3406 Ginter Park 30.0000 27.1845 -2.8155 RE Lee 57.5758 61.7647 4.1889 Mason 37.7778 32.1429 -5.6349 Carver 18.8525 22.2222 3.3697 Oak Grove 32.3529 24.6914 -7.6615 Patrick Henry 55.3191 36.1702 -19.1489 Stuart 50.0000 40.2778 -9.7222 Summer Hill 35.5263 17.3333 -18.1930 Munford 72.6027 81.0526 8.4499 Cary 41.9355 37.2093 -4.7262 Woodville 17.2414 19.2308 1.9894 Westover Hills 21.4286 35.6322 14.2036 Maymont 30.0000 14.2857 -15.7143 Fairfield Court 34.8837 12.5000 -22.3837 Whitcomb Court 26.1905 4.7619 -21.4286 Norrell 32.0000 23.6842 -8.3158 Clark Springs 21.7391 25.0000 3.2609 Chimborazo 28.2609 25.2336 -3.0273 Broad Rock 39.6825 19.6429 -20.0396 Redd 31.1111 55.0000 23.8889 Greene 42.7083 48.9796 6.2713 Reid 40.9524 32.3529 -8.5995 Southampton 54.0541 54.0541 .0000 Fisher 50.0000 74.2857 24.2857 Francis 28.5714 41.9753 13.4039
Note that Richmond started 27 points behind the statewide average, and then declined by 1.4 points while the statewide average improved 5.4 points.
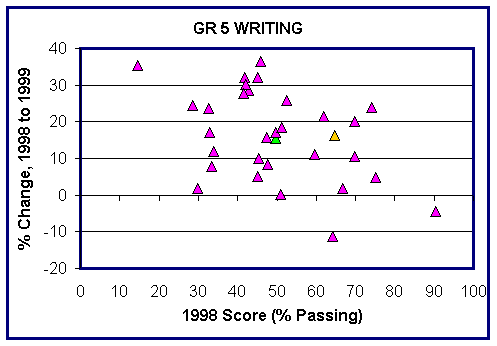
For the Fifth Grade data, we'll leave out the raw data to save space. Writing looks good (at least in comparison):
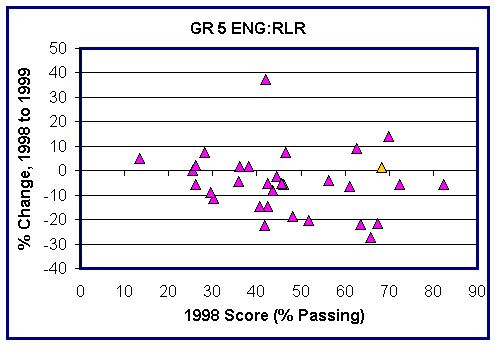
English does not (Note: "RLR" = Reading Literature Research):
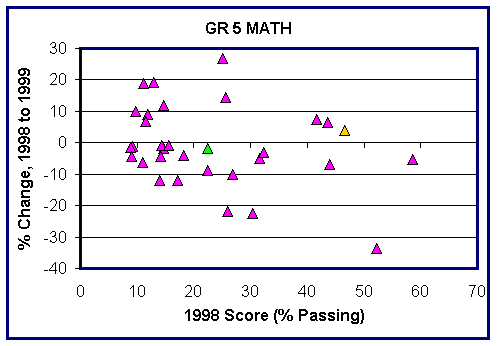
And neither does math:
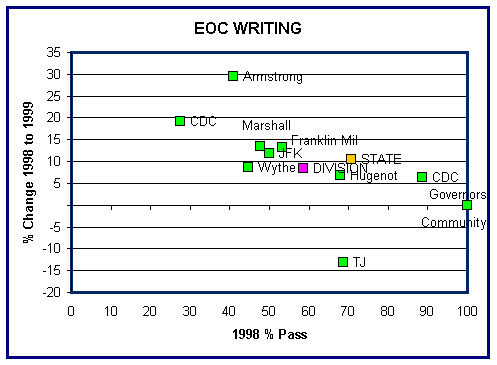
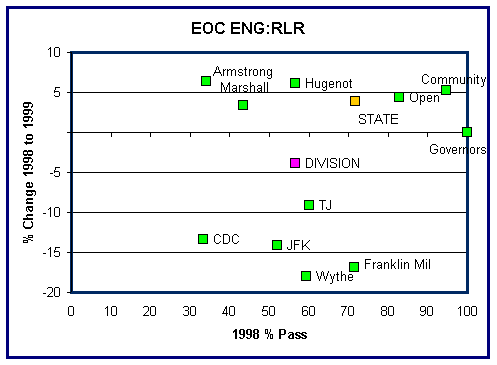
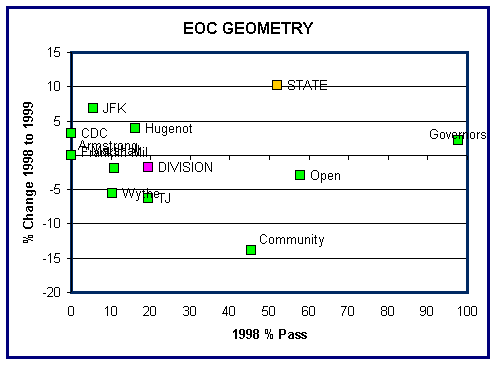
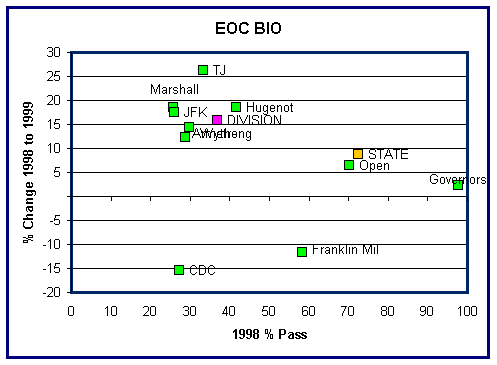
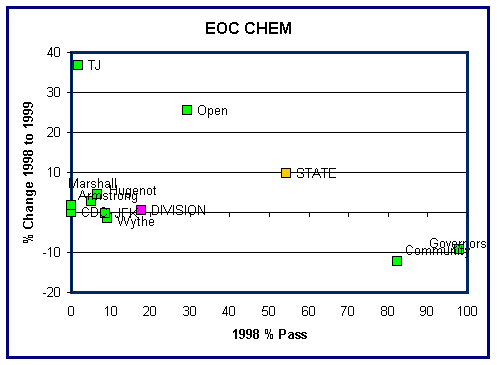
Turning to the high schools, the writing scores look pretty good, and biology shows a much-needed improvement but 'most everything else is an embarrassment (Note: "EOC" = End of Course):
This is a remarkable record of failure.
Back to the Top
Back to the Issues Page
Last updated 02/24/02
Please send questions or comments to John Butcher
