Parent Pages
Sibling Pages
Child Pages
We have obtained the Spring, '99 Richmond SOL data by class. Here are some of them:
Ginter Park Elementary
Third Grade:
Teacher English Hist & SS Math Science Average Copeland 30 20 40 20 28 Holt 48 33 33 38 38 Klotz 18 12 12 12 13 Maxwell 35 35 25 23 29 Mills 38 29 29 43 35 Average 34 26 28 27 or, in terms of a graph:
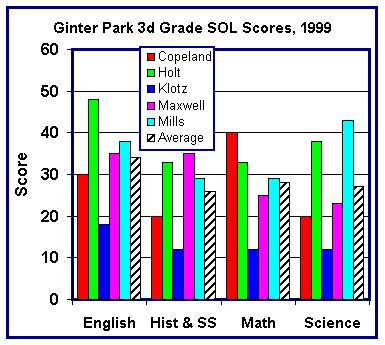
These data tell an interesting story. If we take it that the students are assigned randomly, Holt and Mills are the outstanding teachers here. Both teachers are strong in all four subjects, but Holt's particular strength is English while Mills' is science. Maxwell is near average in three subjects but the strongest performer in history and social science. Copeland is below average in three subjects but the strongest performer in math. Unless Klotz has all the klutzes the data suggest major weakness in all four subjects.
One has to wonder why Holt is not teaching all the English classes, Maxwell all the history & social science, Copeland all the math, and Mills all the science. If there are strong reasons to leave a class with a particular teacher all day, one must wonder whether or how Ginter Park is learning what Holt does right in English, Maxwell in history and social science, Copeland in math, and Mills in science, and what is being done to transmit this information to the other teachers.
Fifth Grade
Teacher English Hist & SS Math Science Computer Average Cobb 36 16 8 40 48 30 Miller 24 5 10 24 71 27 Smith 36 9 27 27 73 35 Woodberry 42 28 8 39 72 38 Average 34 14 13 33 66 Or, as a graph:
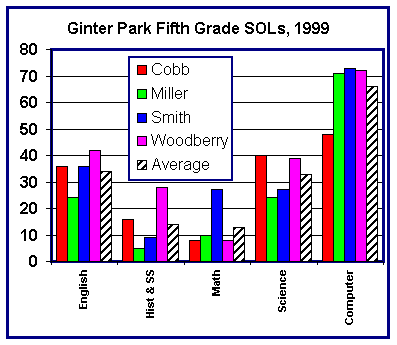
The data here suggest that Woodberry is the outstanding teacher except in Math. Woodberry leads the pack in English (although the numbers are so close that the differences probably are meaningless) and in history & social science, and is a close second in science and computer. Smith is the hands-down leader in math and a slight leader in computing (where the differences again probably are not significant). There are serious problems here in math and history. As with other schools (see below), one has to think that the kids like computing.
Carver Elementary
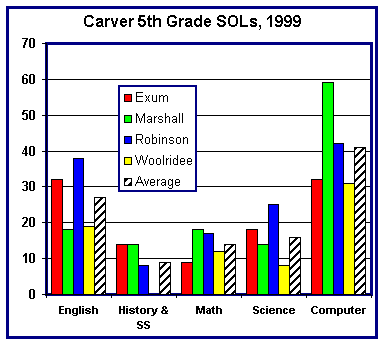
Here are the data for Carver. First the Third Grade and then the Fifth. Send an email if you would like the raw data:

"Woolridee" is thus on the printout. Probably Woolridge in fact.
Looking at the citywide data, we see that except for 5th grade writing and computer, Ginter Park is a little behind the (appalling) Richmond average.
GR 3 ENG GR 3 MATH GR 3 HIST GR 3 SCI SCHOOL NAME 1998 1999 % CHG 1998 1999 % CHG 1998 1999 % CHG 1998 1999 % CHG STATE SUMMARY 55 61 7 63 68 4 49 62 14 63 68 5 DIVISION SUMMARY 35 40 5 40 41 0 27 34 7 37 35 -1 GINTER PARK ELEM. 35 34 0 29 27 -2 21 26 5 30 27 -3 GEORGE W. CARVER ELEM. 22 32 10 24 27 2 11 30 18 19 22 3
GR 5 WRITING GR 5 ENG:RLR GR 5 MATH GR 5 HIST GR 5 SCI GR 5 COMPUTER TECH SCHOOL NAME 1998 1999 % CHG 1998 1999 % CHG 1998 1999 % CHG 1998 1999 % CHG 1998 1999 % CHG 1998 1999 % CHG STATE SUMMARY 65 81 16 68 69 1 47 51 4 33 46 13 59 67 8 72 81 9 DIVISION SUMMARY 50 65 15 46 40 -6 22 20 -2 12 19 7 36 34 -2 47 54 8 GINTER PARK ELEM. 50 67 17 44 35 -8 15 13 -2 7 15 8 38 34 -4 53 66 13 GEORGE W. CARVER ELEM. 45 55 10 40 26 -15 14 13 -1 4 8 5 26 15 -11 30 40 10 The big differences between GP and Carver are that Ginter Park is a bit ahead in the fifth grade but Carver is improving in the third grade (while Ginter Park is not).
Wythe
Turning to High School, here is a summary of data for the science/math classes at Wythe:
Teacher
Algebra I Algebra II Biology Chemistry Earth Science Geometry Avg. Abruzzese 0.0 12.5 6.3 Alexander 0.0 4.2 2.1 Berry 25.4 0.0 12.7 Buckland 12.8 12.8 Carter 0.0 0.0 Chiesa 0.0 0.0 Epps 69.7 69.7 Epps S 54.5 54.5 Flippen 46.5 18.2 32.3 Flippen H 27.3 27.3 Gaines 5.9 0.0 2.9 Hall 31.3 46.1 38.7 Hall I 18.2 18.2 Henderson 0.0 6.4 3.2 Johns 25.0 25.0 Johnson 14.2 14.2 Johnson S 7.7 7.7 Jones 0.0 0.0 Jones H 33.3 0.0 16.7 Miller 30.4 2.0 16.2 Thomas 0.0 0.0 Turnage 17.8 17.8 Winston 0.0 0.0 0.0 0.0 Winston M 0.0 0.0 Average 6.5 0.0 45.3 12.9 21.1 3.9 There could be either one or two Epps, Flippens, Halls, Johnsons, or Winstons. There are, for instance, a couple of reports that say "Flippen" and one other that says "H Flippen." On these data, one can't say whether these are different people.
In any event, the numbers are shocking. Even the star here, biology, is almost 10 points behind the State average.
Even so, it is clear that I would want my kid (hypothetically; I have no children to speak of and even if I had one, she would not go to this place) to take Algebra I from H Jones, Biology from Epps, Chemistry and Earth Science from Hall, and Algebra II and Geometry not at all.
Thus, there are teachers here that clearly are doing much better than others. Yet we are not hearing the Richmond system set out to find out what the better ones are doing right, and to pass that information to the others who so obviously need it. Indeed, as the collected data show, we are seeing the Richmond start way behind and slip farther behind.
Here are the English/History data for Wythe. They do not inspire confidence:
Teacher English US Hist. World Hist Coalter 3 Friend M 29 Holman R 40 Moeser S 56 Quinton 6 Taylor 0 Thornton 11 Average 42 1 8 A couple of these data raise questions. One section was labeled "Friehd." I took that to be "Friend" and reported it thus. Moeser had one section that racked up 100%, but only seven kids took the test. That may well have been a special section. (Here and above I deleted the very small (4 or fewer) sections) The averages above are not weighted so Moeser's average is boosted unreasonably by that section.
Even so, the '99 statewide average for English was over thirty points higher than the Wythe average.
Marshall
In contrast to Wythe, where the scores generally declined from '98 to '99, the scores at Marshall generally improved some last year. Even so, the Marshall scores do not indicate a place where you would want your kid to be. First the science/math scores:
Teacher Algebra I Algebra II Biology Chemistry Earth Sci. Geometry Average Bhaghat 0 11 5.6 Bibby 24 23.5 Black 2 2.4 Black 0 0.0 Boyd 58 57.9 Brent 28 27.8 Carter 18 17.6 Chavis 41 40.9 Crawley 33 33.3 Davis 12 11.8 Davis Joyce 0 0.0 Davs* 17 16.7 Dowling 0 0.0 Hauck 0 0.0 Hobbs 40 40.0 Holmes 10 9.5 Hudson 29 18 23.8 Hurley 0 0.0 James P 6 5.6 Jones 13 12.5 Jones D 0 0.0 Jones M 63 63.2 Louis 6 6.3 McClain 13 12.5 McKenzie 27 26.7 Morris 0 18 8.8 Nabors 16 9 12.3 Paris 0 0.0 Pretlow 6 20 12.8 Quraishi 41 40.9 Ramsay 16 15.8 Ramsey 44 44.4 Robinson 21 5 13.1 Russell 0 11 5.6 Sadler 29 29.4 Samuels 7 6.7 Smith 6 6.3 Sprout 0 31 15.7 Starks 0 0.0 Tapper 0 0.0 Tunstall 5 5.3 Waller 6 5.9 Waters 22 22.2 Wood 6 6.3 Average 1.1 9.7 43.8 8.9 19.5 7.5 Note: When you see a 4, 5, or 6 in these tables it generally represents one kid who passed out of a class of ca. 20. A score around 10 generally indicates that two kids in the class passed.
Again the Biology numbers are consistently better, albeit some 35 points behind the statewide average. Looking at these and the citywide biology numbers leads to the inference that the Richmond schools are doing something much better in biology than in the other subjects.
The English numbers are bad, as at Wythe, and the history numbers are dismal:
Teacher English US Hist World Hist Average
Adams 0 0 Boye 6 6 Brent 50 0 25 Brooks 56 56 Carter 16 16 Dandridge 33 33 Hurley 6 6 Jones M 27 27 Mann 32 32 Morris 11 11 Nabors 6 6 Nunery 11 11 Pretlow 47 13 30 Ramsay L 57 0 29 Ramsey 11 11 Robinson R 56 6 31 Robinson S 0 0 Russell 0 0 Sadler 5 5 Samuels 13 13 Sprout 0 0 Threatts 0 0 Waters 0 0 Wyant 0 0 Average 43 5 6 Here are Wythe & Marshall compared to the City and State averages for '98 and '99:
EOC ALG I EOC GEOMETRY EOC ALG II EOC EARTH SCI EOC BIO EOC CHEM SCHOOL NAME 1998 1999 % CHG 1998 1999 % CHG 1998 1999 % CHG 1998 1999 % CHG 1998 1999 % CHG 1998 1999 % CHG STATE SUMMARY 40 56 16 52 62 10 31 51 21 58 65 7 72 81 9 54 64 10 DIVISION SUMMARY 14 20 6 19 18 -2 9 13 4 25 33 8 37 53 16 18 18 1 JOHN MARSHALL HIGH 7 1 -6 11 9 -2 0 10 10 15 20 5 26 44 18 5 8 3 GEORGE WYTHE HIGH 1 3 2 10 5 -6 1 1 0 11 20 9 30 44 14 9 8 -1
EOC WRITING EOC ENG:RLR EOC U.S. HIST EOC WHIST_B EOC EARTH SCI SCHOOL NAME 1998 1999 % CHG 1998 1999 % CHG 1998 1999 % CHG 1998 1999 % CHG 1998 1999 % CHG STATE SUMMARY 71 81 11 72 75 4 30 32 2 41 47 6 58 65 7 DIVISION SUMMARY 58 67 9 56 53 -4 10 10 0 13 17 3 25 33 8 JOHN MARSHALL HIGH 48 61 13 43 47 3 1 4 3 9 6 -3 15 20 5 GEORGE WYTHE HIGH 45 53 9 59 41 -18 3 1 -2 4 10 6 11 20 9 I will be posting other data. This will take a while: The School Board produced the information as hard copy. Apparently they cannot handle them in electronic form (sigh). Send an email to the address below if you would like to look at the original data.
Back to the Top
Back to the Issues Page
Last updated 02/24/02
Please send questions or comments to John
Butcher