Parent Pages
Sibling Pages
Child Pages
Even aside from the lousy performance on the standardized tests, the data show an overwhelming problem in the Richmond Public Schools.
For example, Richmond has the very worst attendance rate in the Commonwealth. See the Dept. of Education web site for the full report. Here is an excerpt, showing Richmond, the near suburbs, and the urban jurisdictions that have SOL scores as bad or nearly as bad as Richmond:
[Excerpt from Table 8] 1998 - 1999 Average Daily Membership (End-of-Year) Average Daily Attendance (End-of-Year) Percent Attendance (End-of-Year) Division Elem. Sec. Total Elem. Sec. Total Elem. Sec. Total Richmond 20,331 8,209 28,540 18,990 7,086 26,076 93.4 86.3 91.4 Petersburg 4,180 1,825 6,005 3,903 1,595 5,498 93.4 87.4 91.6 Danville 4,893 2,847 7,740 4,594 2,587 7,181 93.9 90.9 92.8 Suffolk 7,407 3,661 11,068 7,043 3,300 10,343 95.1 90.1 93.4 Portsmouth 10,137 6,911 17,048 9,668 6,323 15,991 95.4 91.5 93.8 Norfolk 24,004 11,515 35,519 22,961 10,469 33,430 95.7 90.9 94.1 Chesterfield 32,030 18,281 50,311 30,650 17,267 47,917 95.7 94.5 95.2 Henrico 25,726 14,556 40,282 24,665 13,706 38,371 95.9 94.2 95.3 Hanover 10,097 5,734 15,831 9,778 5,488 15,266 96.8 95.7 96.4 State 131,398 69,878 201,276 125,209 64,521 189,730 95.3 92.3 94.3 In terms of graduation rate, Richmond is 9th from the bottom (of 130 jurisdictions) and over 15 points behind the State average. Here are the numbers for Richmond, compared again to the suburbs and the comparable urban jurisdictions.
[Excerpt from Table 5] Graduates as Percent of Ninth Grade Membership Four Years Earlier Regular Term Plus Summer Term, 1998-99
Membership Ninth Grade Standard Diploma Advanced Diploma Special Diploma Program Cert GED Cert Total Graduates Division 1995-96 1998-99 1998-99 1998-99 1998-99 1998-99 1998-99 % Norfolk 2,806 788 521 46 12 4 1,371 48.9 Petersburg 501 178 58 24 1 0 261 52.1 Portsmouth 1,421 430 345 37 0 24 836 58.8 Richmond 1,852 411 561 29 37 63 1,101 59.4 Suffolk 892 296 217 7 19 0 539 60.4 Chesterfield 3,981 1,059 1,911 0 34 0 3,004 75.5 Danville 519 210 179 13 0 0 402 77.5 Hanover 1,120 311 615 11 1 10 948 84.6 Henrico 2,735 909 1,286 30 70 36 2,331 85.2 State 86,779 29,329 33,466 1,080 623 847 65,345 75.3 In terms of administrative expense (not education, mind you, administration) for our schools, the Auditor of Public Accounts data show that Richmond is 12th from the top in per capita expenditure. If we relate those data to the '99 enrollments from the State Education Dept, we see the following:
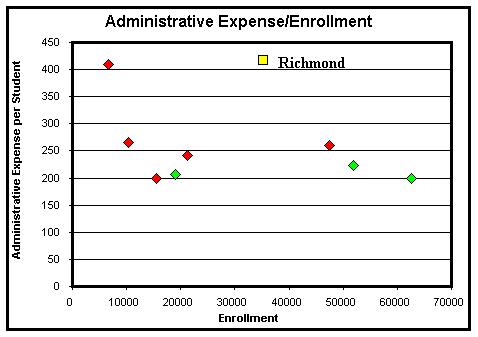
Jurisdiction Admin. Expense Enrollment Admin. Expense/Enrollment Richmond $ 14,715,306 35279 $ 417 Petersburg $ 2,738,518 6675 $ 410 Danville $ 2,761,424 10415 $ 265 Norfolk $ 12,350,135 47440 $ 260 Portsmouth $ 5,132,550 21208 $ 242 Henrico $ 11,620,418 51924 $ 224 Hanover $ 3,900,000 18954 $ 206 Chesterfield $ 12,546,255 62703 $ 200 Suffolk $ 3,079,640 15469 $ 199 Or, in graphical terms, notice how everybody but Richmond fits the line:

And, among the suburbs and similar cities, only Petersburg spends nearly as much per student on bureaucrats as we do:

"But what," you ask, "is the big deal between $250 per student (the average of those other jurisdictions, including expensive Petersburg) and $417 per student (the cost in Richmond)?" Well, for a class of 20 students, the difference is $3340, enough to give a very nice raise to the teacher.
And remember, we're getting these lousy attendance rates and substandard graduation rates and crummy SOL scores and declining Stanford 9 scores for about $2,5000 more per student than the other Virginia jurisdictions.
That money, by the way, comes from your pocketbook and mine. The Commission on Local Government keeps score on this. The calculate, for example, the "revenue effort" of each Virginia jurisdiction. That number is the revenue extraction (taxes, fees, et al.) divided by the revenue capacity (taxable property, mostly), and expressed as a ratio to the statewide average. According to the '97 data (the latest available on the Web), Richmond has been first or second in the state in revenue effort
Locality Revenue Effort, 1992/93 Rank Score Revenue Effort, 1993/94 Rank Score Revenue Effort, 1994/95 Rank Score Revenue Effort, 1995/96 Rank Score Revenue Effort, 1996/97 Rank Score Norfolk City 1.5402 3.0 1.5404 3.0 1.6323 2.0 1.6219 2.0 1.5746 1.0 Richmond City 1.5925 2.0 1.6669 1.0 1.6657 1.0 1.6407 1.0 1.5516 2.0 Portsmouth City 1.4635 5.0 1.4016 7.0 1.4163 5.0 1.4533 5.0 1.4443 5.0 Petersburg City 1.3459 12.0 1.3590 12.0 1.3212 11.0 1.3509 12.0 1.3184 14.0 Suffolk City 1.0023 40.0 1.0084 41.0 0.9570 44.0 0.9781 43.0 0.9845 44.0 Henrico County 0.9309 46.0 0.9152 47.0 0.9222 48.0 0.9113 48.0 0.9114 50.0 Chesterfield County 0.9567 43.0 0.9326 46.0 0.9156 49.0 0.9106 49.0 0.9078 53.0 Danville City 0.9111 48.0 0.8925 50.0 0.8947 51.0 0.9225 47.0 0.8945 55.0 Hanover County 0.6859 76.0 0.6668 80.0 0.6736 79.0 0.6931 76.0 0.7155 75.0 As you see, the Richmond revenue effort has been running 55-60% higher than the state average. Those data come as no surprise to those of us who notice we are paying 50% more on our real estate taxes than the Counties, plus the City taxes our cars, our water, our sewage, our garbage, our gas, our electricity, our telephones, and our meals. They even get a cut from the State on our booze. Doubtless they would tax the air we breathe if they could figure out a way.
There's a question here why we tolerate paying so much more money for such terrible results.
Last updated
02/24/02
Please send questions or comments to John
Butcher
