Parent Pages
Sibling Pages
Child Pages
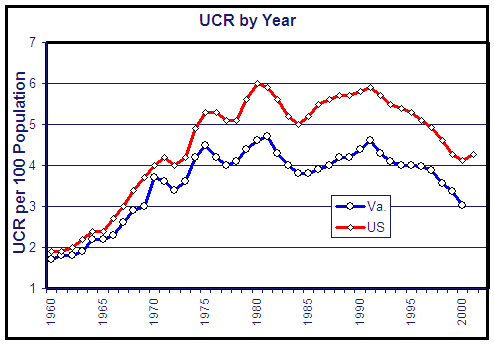
The FBI’s Uniform Crime Report (UCR) is the basic statistic for counting crime in the United States. Let's begin with a look at the UCR data for the last forty years:
Here we see that crime in Virginia and the United States (as measured by the UCR) more than doubled from 1960 to 1975. Even with the much-touted reduction since 1991, the crime rate still is double what it was in 1960. Follow the link to see the Bellevue data.
In fact, the UCR captures only a fraction of the actual crime. First, the Type I UCR Index, the measure we most often see reported in the media, only includes murder, rape, aggravated assault, robbery, larceny, burglary, and vehicle larceny. (In recent years the FBI has reported a "modified" index, that also includes arson.) Second, a crime only reaches the UCR if it is "known to the police," i.e. if it has been reported and the police have entered it in their system. Comparisons of the UCR data with the Census Bureau’s National Crime Victimization Surveys indicate that overall the UCR is capturing about 35% of the crime the UCR is supposed to count:
UCR as % of NCVS
Type of crime
1994
1995
All crimes
35.8%
35.3%
Personal crimes
41.2%
41.6%
Crimes of violence
41.6%
41.7%
Rape/sexual assault
31.7%
32.0%
Robbery
55.4%
55.1%
Assault
40.1%
40.2%
Property crimes
33.9%
33.2%
Household burglary
50.5%
50.4%
Motor vehicle theft
78.2%
74.4%
Theft
26.8%
26.3%
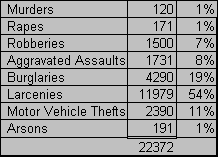
Turning again to the UCR data, it is apparent that property crime dominates the index. For example, the 1995 data for Richmond are as follows:
The property crimes here are about 85% of the total. Richmond has about 3% of the Virginia population and about a quarter of the murders. But you could halt all murders in Richmond without so much as a ripple on the UCR.
The academic commentators also have some things to say about the UCR. For instance:
"[P]olice departments show evidence of rising or falling crime rates based upon the political pressures they are experiencing."
-- Dennis W. Banas, Robert C. Trojanowicz, Uniform Crime Reporting and Community Policing: An Historical Perspective, National Center for Community Policing, School of Criminal Justice, Michigan State University
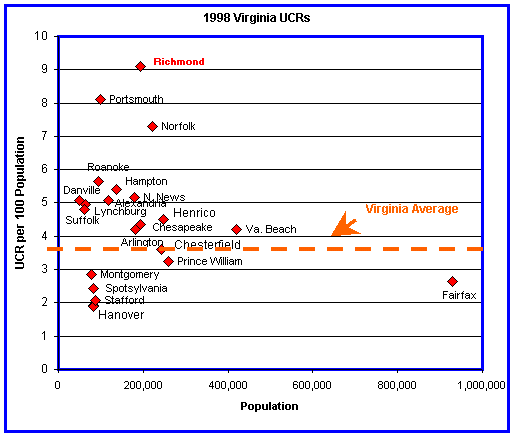
Whatever the ultimate meaning of the UCR, the 1998 data show that Richmond leads the major Virginia cities in the UCR index:
This 9.1 value for Richmond compares to a Virginia average of about 3.5 crimes per hundred people per year, and a United States average of about five. That is, Richmond has almost twice the average crime of the US and about 2.5 times the Virginia average. Moreover, if Richmond is similar to the rest of the country in terms of the rate of unreported crime, the 9.1 UCR crimes per 100 population represents an actual crime rate closer to 30 crimes per hundred (i.e., three crimes per ten people every year!).
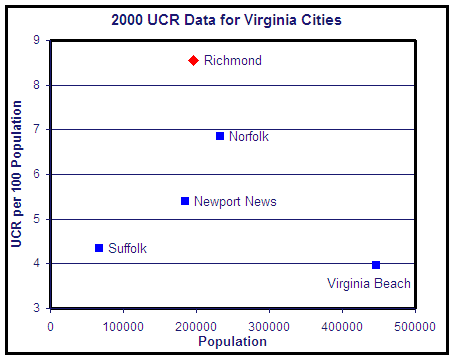
The 2000 data give a more current view of this subject, albeit for a smaller set of cities. Again, Richmond is the winner.
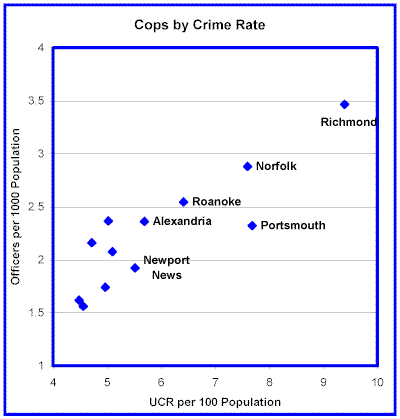
Turning to the relationship between the number of crimes and the number of police, the Virginia cities show a clear trend: As the crime rate increases, so does the size of the police department (1997 data):
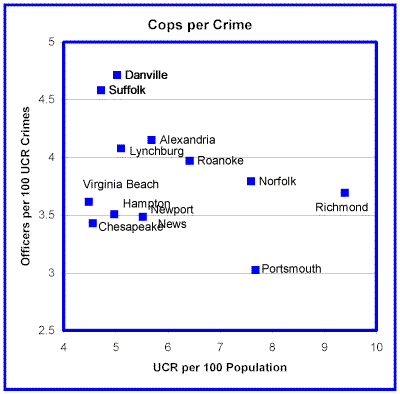
But the increase in cops doesn't keep up with the increase in crime. As a result, the high-crime Virginia cities have fewer police officers to deal with each crime (again, 1997 data):
Thus, Richmond (which has expanded its force recently) had 3.7 officers per 100 crimes per year in 1997, while Roanoke had 4.0 and Danville, 4.7.
Last updated 02/24/02
Please send questions or comments to John Butcher
