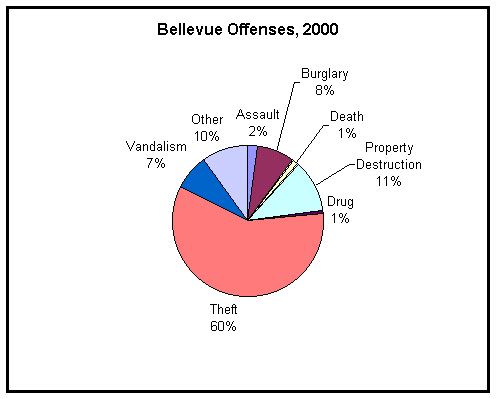
[ Home ] [ Up ] [ Bellevue Tour ] Summarizing the Bellevue data for 2000 by general subject, we obtain:
OFFENSE_DESCRIPTION Total Assault, Simple 3 Assault, Simple, Domestic 4 BURGLARY 9 BURGLARY/B&E/COMMERCIAL 5 BURGLARY/B&E/RESIDENTIAL 13 DEATH INVESTIGATION 3 Death, Traffic Related 1 Property Destruction/Private Property 37 DRUG/NARCOTIC VIOLATIONS 2 DRUNKENNESS 2 DUI, ALCOHOL 1 EMBEZZLEMENT 1 FOUND PROPERTY 1 FREQUENTING DISORDERLY HOUSE 1 GAS DRIVE OFF 2 Traffic, Hit & Run 12 Larceny from Building 18 Larceny from Motor Vehicle 103 Larceny, All Other 18 Larceny, Motor Vehicle 24 Larceny, Motor Vehicle Parts 22 Larceny, Shoplifting 9 OBSCENE/THREATENING PHONE CALL 1 Offenses, All Other 5 PROMISCUOUS SHOOTING 1 ROBBERY 2 RUNAWAY 1 TRESPASS OF REAL PROPERTY 2 VANDALISM/DESCTRUCTION/DAMAGE OF PROPERTY 24 WEAPON LAW VIOLATIONS 1 TOTAL 328 Remember that these do NOT compare directly to the earlier UCR data.
Fully 60% of these are thefts:
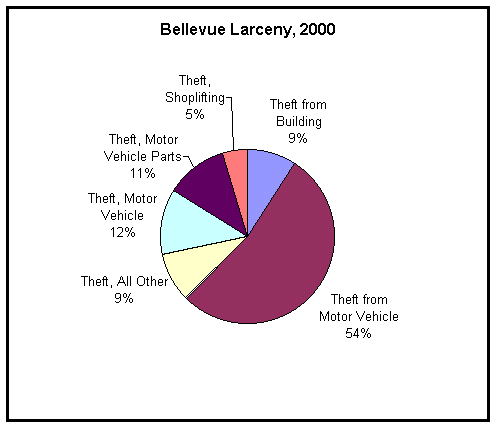
And most of the thefts are preventable by taking our property in from the car or shed:
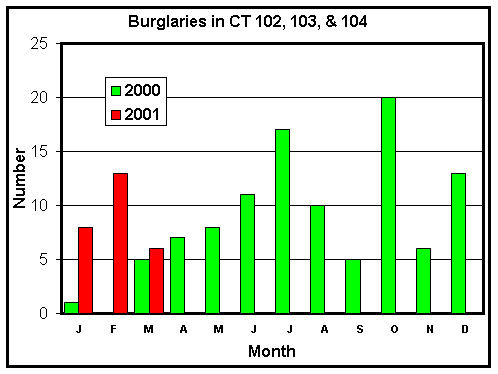
The residential burglary rate looks to be high compared to 1999. The early 2001 data seem to show an increase. Here, for instance, are the residential + commercial B&Es for 2000 and the first quarter of 2001 for Census Tracts 102, 103, and 104 (i.e., for our part of town and the immediate surroundings:
The 2000 data show the expected shape (maximum in summer with a spike in December) with an added bunch in October. The 2001 data will be alarming if the rate continues.
Back to the 2000 Bellevue Data
Back to the Top
Last updated 02/24/02
Please send questions or comments to John Butcher


